If your computer is running slow, you should double-check what your resources are being affected by. But how do you check your hardware usage in Windows 10/11?
If everything is starting to go fine in Windows 10/11, you should check your system usage. Your computer software makes good use of RAM (Random Access Memory), CPU (Central Processing Unit) and GPU (Graphics Processing Unit), but sometimes an application demands too much from your PC. Friend.
Windows 10/11 includes a trio of built-in tools with which you can check system resource usage. You can use these tools to monitor your system's resource usage and see how demanding your programs are. Hence, here is how to check your CPU, GPU and RAM usage in Windows 10/11
A. How to check Windows 10/11 system resource usage with task manager
Task Manager is one of the main system resource monitoring utilities of Windows 10/11. This tool is the easiest way to see what programs and processes are running and how much resources each of these programs and processes is taking up.
1. Press CTRL + Shift + Esc to open the Task Manager.
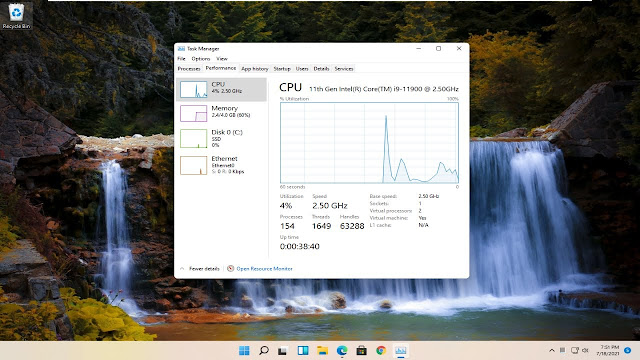
2. Click the Performance tab. This tab shows your system's RAM, CPU, GPU, and disk usage, along with network information.
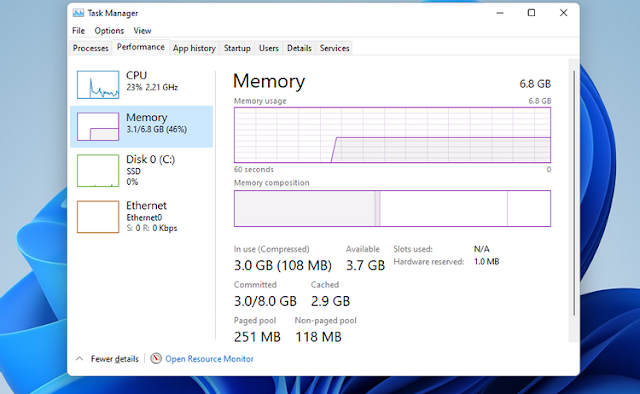
3. To see RAM usage, check the Memory box. That box provides information about how much RAM is being used and how much space is left.
4. You can check your computer's processor usage by clicking the CPU box. The processor box shows you the variable CPU percentage usage along with speed details.
5. Click the GPU box to see how much GPU memory is being used. If your PC has two GPUs, you can check two separate boxes for both in the Task Manager.
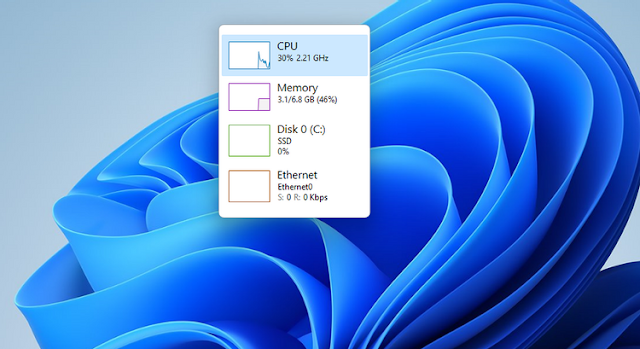
Task Manager also has a neat summary view that shows only system resource usage boxes. To switch to that view, right-click in Task Manager and select Summary View. The Task Manager's window will then minimize as shown in the snapshot directly below.
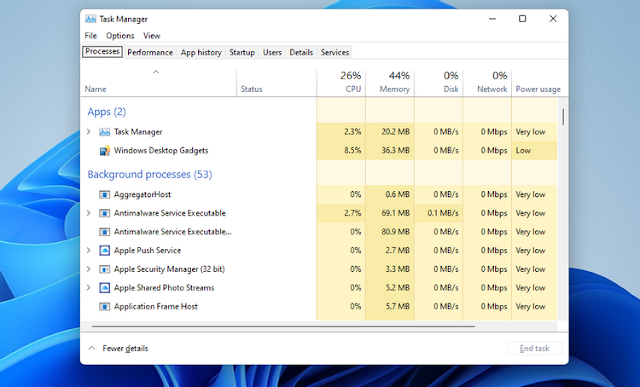
If you want to see which programs are consuming the most resources, click the Processes tab. This tab shows all running apps and background processes along with their memory, CPU, disk, network, and GPU usage. There, you can free up system resources by selecting unnecessary third-party background programs (or processes and services) that you don't need and clicking End task.
B. How to check Windows 11 system resource usage with resource monitor
Resource Monitor is a slightly more detailed system resource monitoring utility than the Task Manager in Windows 10/11. That tool displays resource usage information for memory, CPU, disk, and network with Task Manager-like graphs.
1. Open the Windows 10/11 search engine. Type Resource Monitor in the search box.
2. Click Resource Monitor to open its window.
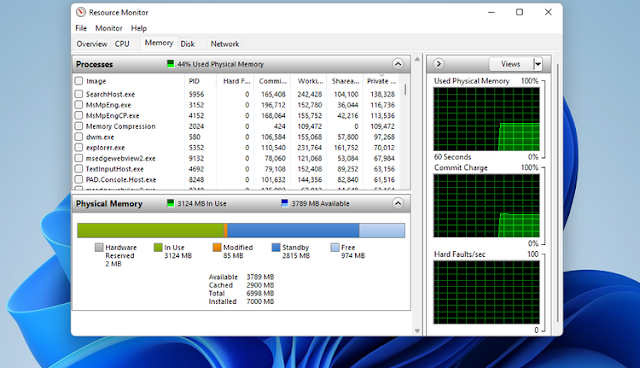
3. Select the Memory tab to view its resource usage graphs. That tab includes a graph of physical memory that shows how much memory is currently being used, how much is available, and how much is in standby, along with detailed information on usage rates.
4. Click the CPU tab to see a graph of its processor usage percentage.
5. Select the Network tab to view processes with network (internet) activity.
6. Click Overview to view memory, CPU, network, and disk usage details in one tab.
Video:
C. How to check Windows 10/11 system resource usage with performance monitor
Performance Monitor is a handy tool designed to help you analyze system performance and resource usage. This tool provides system summaries and performance reports with real-time performance graphs.
Admittedly it is a rather complicated utility; however, it is a useful tool for advanced users to understand its information.
1. Press the Windows Keys + S then type Performance Monitor in the search box that opens.
2. Then click Performance Monitor to bring up that tool.
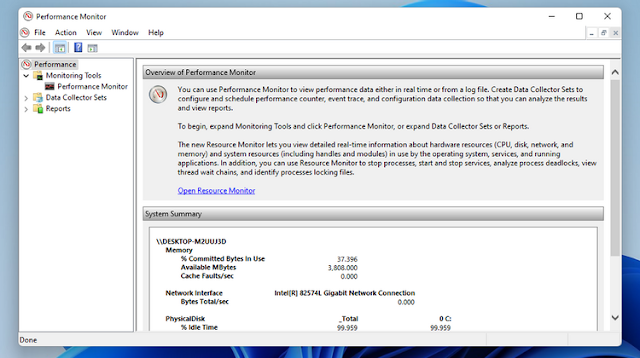
3. Select Performance on the left side of the window to view summary system resource usage data.
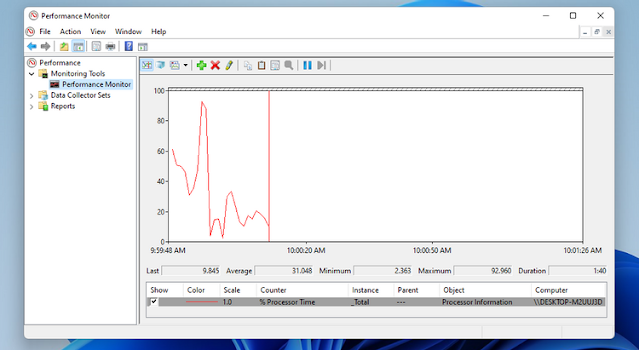
4. Click Performance Monitor to see real-time performance data. By default, the graph shows the processor performance counter.
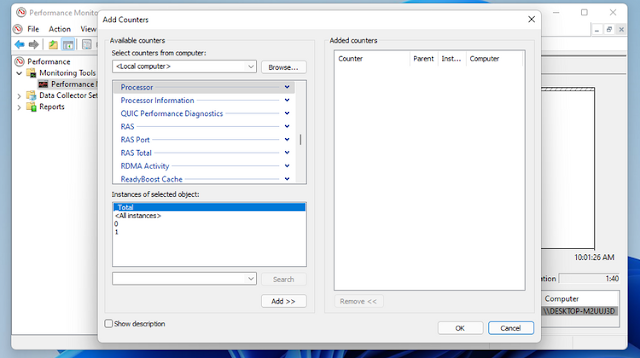
5. To add more counters to the chart, click the + Add button.
6. Then select a counter, such as Memory, on the window shown directly below. The commit byte stream for the Memory counter highlights the average RAM usage over time.
7. Press the Add button.
8. Click OK to see the performance data for your selected counter on the chart.
You can better analyze this data by creating data collectors. To do that, select the Data Collector set in the Performance Monitor. Right-click User Defined and select New > Data Collector. You can then set up the new data collector using the wizard that opens.
Information from the data collection aggregators will be available with the reports. You can view information from the data collector you've run by clicking Reports in Performance Manager. Then select User Defined to view your data reports.
D. Add System Resource Widgets to Windows 10/11 Desktop With 8GadgetPack
Having a system resource monitoring utility on your desktop is a handy way to keep an eye on what's going on inside your PC. However, Windows 10/11 does not have a way to add a resource management utility to the desktop.
Luckily, you're still out of luck. Instead, you can install the freeware 8GadgetPack, which includes a great collection of desktop utilities, including a system resource monitor.
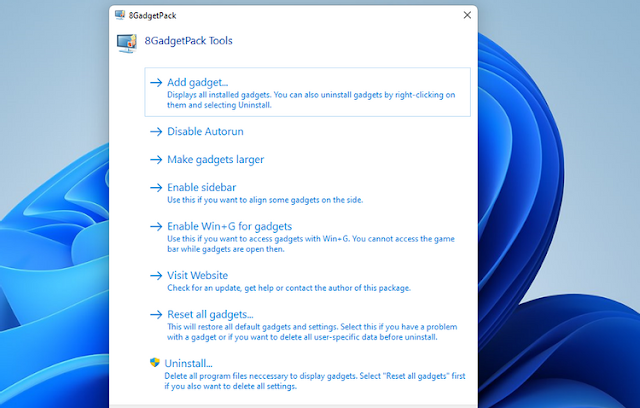
1. You can get this handy tool by clicking the Download button on the 8GadgetPack website. Then, open the setup wizard from the folder where you downloaded the setup wizard to install the software. Then, open the 8GadgetPack window shown directly below.
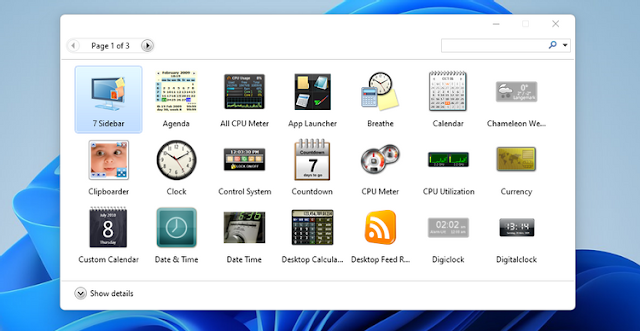
2. Press the Add Widget button there to bring up the widget selection window. Type System Monitor in the search box. Then, select System Monitor II to add that utility to the monitor.
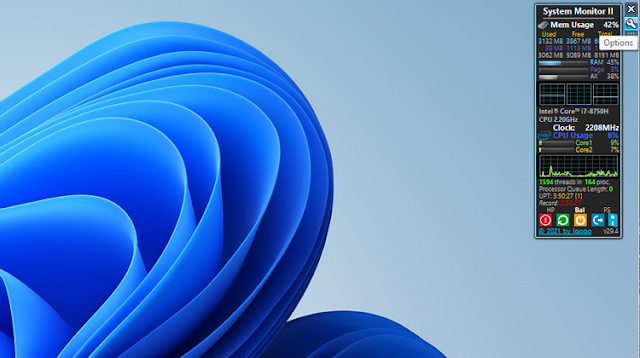
3. The System Monitor II utility mainly displays the percentage of RAM and CPU usage. It also includes handy Shutdown, Restart, and Standby buttons. You can configure that, and any other 8GadgetPack widget, by clicking its Options button—it's the widget that looks like a wrench.
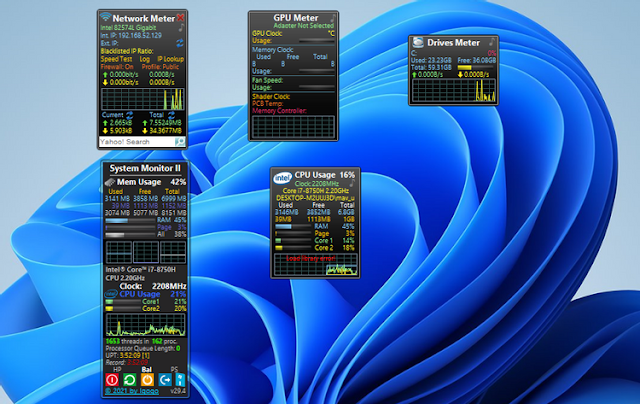
4. In addition to System Monitor II, there are other system resource utilities. You can choose GPU Meter to add a GPU monitor to your desktop. The CPU Usage widget shows processor usage, while Network Meter shows your upload and download usage. You can also view disk activity by adding Drive Meter to the desktop.
Free up your hardware again
Windows 10/11 will become slower and less responsive to your actions when system resource usage is high (especially for RAM and CPU). Whenever you feel the need to speed up Windows, check your PC's resource usage using the tools and utilities above.
Once done, you can determine which programs or background processes are taking up the most resources and close them. And once they're finished, you'll notice an overall improved system performance.


No comments:
Post a Comment